
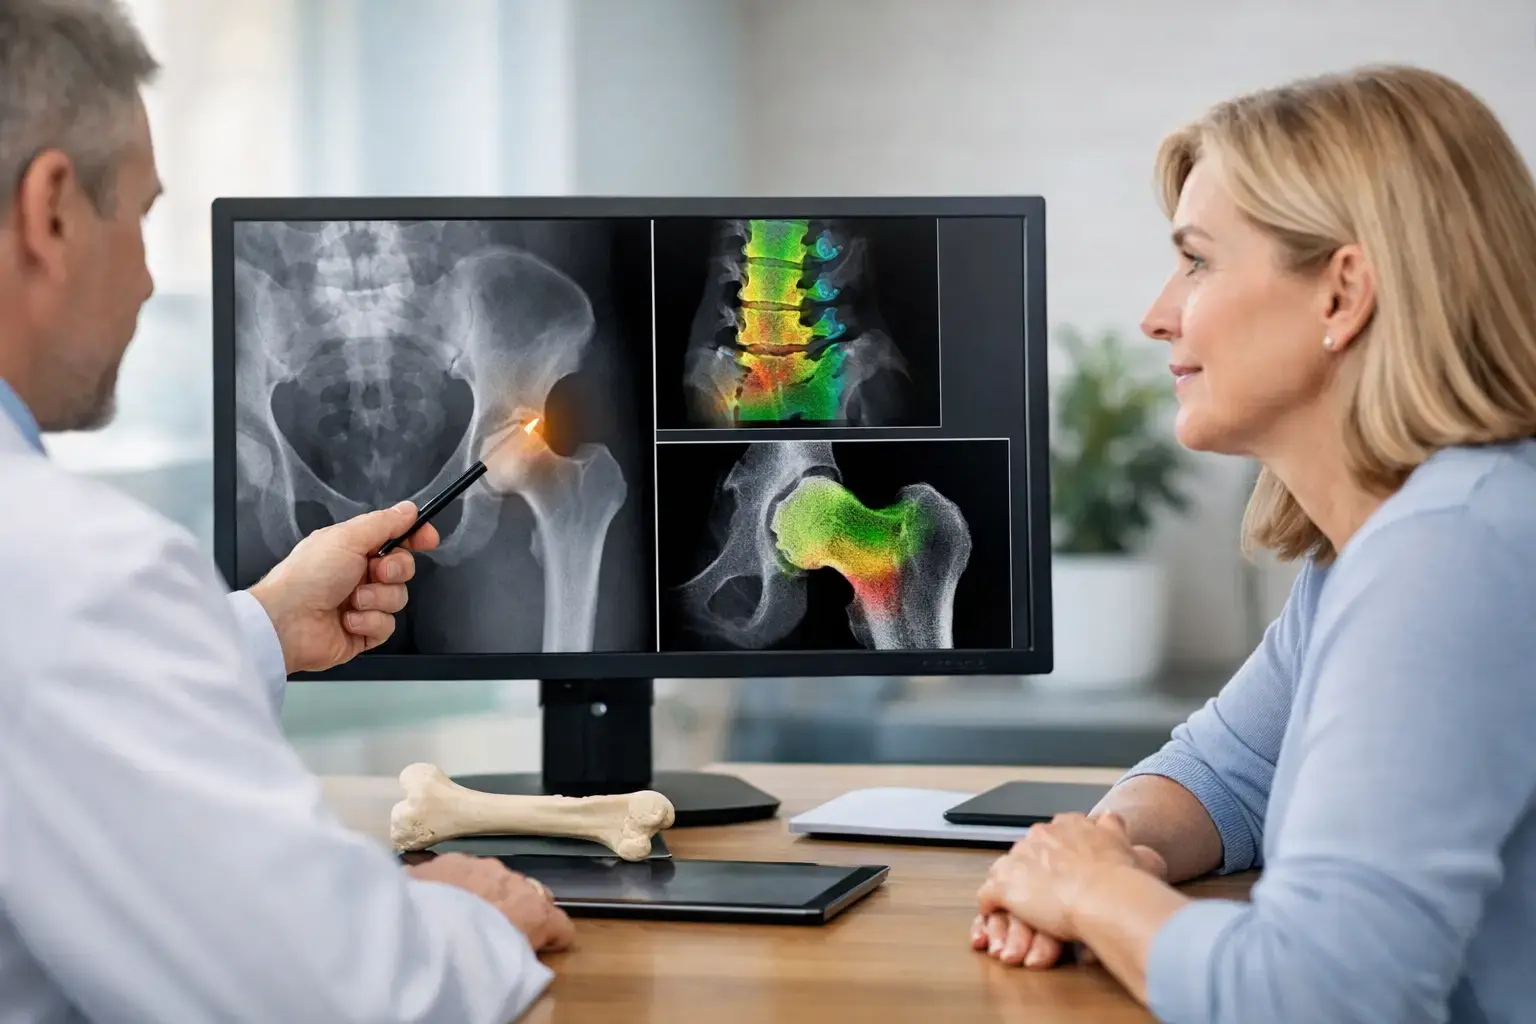
A bone-density result can be reassuring and still leave a central question unanswered: how likely is a fracture in the years immediately ahead? A five year fracture risk assessment is designed to make that question more concrete by looking beyond the amount of mineralized bone alone.
That distinction matters if you are in menopause, have been told you have osteopenia or osteoporosis, live with type 2 diabetes, or simply want a meaningful baseline before a health event forces the conversation. A T-score describes density. Fracture risk asks what density, together with signs of skeletal fragility, may mean for your bones over time.
What a five year fracture risk assessment estimates
A five-year fracture risk assessment estimates the probability of a fracture over the next five years. It is an estimate, not a forecast of a single person's future. It cannot say whether you will fall, which bone might break, or exactly when an event could occur.
What it can do is turn several pieces of bone information into a timeframe that is easier to use in a clinical conversation. Rather than treating a density result as the whole story, risk assessment asks how the bone's measured density and fragility-related characteristics fit together.
The five-year horizon is useful because bone health is not static. Menopause, aging, certain medications, weight change, chronic disease, cancer treatment, and changes in mobility can all alter the conditions that shape skeletal health. A near-term estimate gives you and your clinician a more immediate reference point while leaving room to monitor changes over time.
Why density alone cannot answer the fracture question
Bone mineral density, or BMD, remains valuable. It measures how much mineralized bone is present, typically at clinically important sites such as the lumbar spine and proximal femur. Lower density is associated with higher fracture risk, which is why BMD has long been central to bone assessment.
But density is one measurement of a more complicated biological reality.
Imagine two people with similar BMD at the hip. On paper, their density results may look nearly identical. Yet the ultrasound signals reflected from their bones may show different patterns associated with fragility. If one person's signal-derived Fragility Score is higher, the two people may not carry the same estimated fracture risk, despite having similar density.
That is not because density is wrong. It is because density does not capture every sign relevant to fragility.
Type 2 diabetes is one of the clearest examples of why this gap matters. People with type 2 diabetes can have normal or even higher BMD while experiencing elevated fracture risk. Research has linked diabetes-related skeletal risk to factors that density does not fully represent, including changes in bone material properties associated with chronic high glucose exposure, as well as a higher likelihood of falls in some individuals. A normal density result in this setting is useful information, but it should not automatically close the fracture-risk conversation.
The same principle can matter with long-term glucocorticoid use, rapid weight loss, and certain cancer-treatment histories. Each situation has its own biology and clinical context. The common thread is that a density number alone may not fully explain skeletal risk.
How REMS adds information beyond density
Radiofrequency Echographic Multi Spectrometry, or REMS, uses radiation-free ultrasound to assess bone at the lumbar spine and proximal femur. Like other bone assessments, it provides a measure of bone mineral density. It also analyzes the raw ultrasound signals reflected from the bone.
From those signals, REMS derives an independent Fragility Score. The score reflects signal patterns associated with bone fragility that BMD alone does not capture. It is not a measurement of flexibility, microarchitecture, failure load, or every aspect of bone quality. Those are distinct concepts. Its value is more specific: it contributes independent information about fragility beyond the density measurement.
REMS then weighs BMD and the Fragility Score together to estimate five-year fracture risk. This creates a more complete answer to three connected questions:
- How much mineralized bone is present?
- Is the bone showing ultrasound-signal signs associated with greater fragility?
- What do those findings mean together for estimated fracture risk over five years?
For someone who has spent years following only a T-score, this can change the nature of the conversation. The question becomes less about whether a number crosses a single threshold and more about whether the available information tells a consistent story.
What the result can clarify for you
A five-year risk estimate can be especially helpful when the numbers do not line up as neatly as expected. A person may have modestly low density with a lower Fragility Score, or density that appears relatively reassuring alongside a higher Fragility Score. Neither pattern should be interpreted in isolation. The point is not to create a new number to worry about. The point is to reduce the blind spot created when one number has been asked to carry too much meaning.
If you have osteopenia or osteoporosis, the assessment may give you a clearer baseline for a discussion with your physician. If you are considering medication, monitoring a major health transition, or preparing for an orthopedic procedure, objective information about both density and fragility can help frame the questions you bring to your care team.
For prevention-focused adults, the value may be simpler: you can measure bones before a fracture becomes the first signal that something was changing. Most people track blood pressure, glucose, cholesterol, exercise capacity, or body composition long before a complication occurs. Bone health deserves the same opportunity for informed attention.
Why measurement precision matters over time
A fracture-risk estimate is most useful when it can be followed thoughtfully. That is where measurement precision matters.
Every testing method has some degree of measurement variation. If a method's error range is large, a small change on a report may reflect testing noise rather than a real biological change. If the error range is lower, smaller changes can be interpreted with greater confidence in the appropriate clinical context.
REMS is FDA-cleared and radiation-free, with reported intra-operator precision error below 0.5%. This is lower than the 0.9% to 1.9% precision error commonly reported for DXA at the spine. Precision does not make a single scan definitive, and results still need to be interpreted alongside your health history. It does mean that repeat measurements can offer a more sensitive view of change than a less precise test may allow.
That is relevant during periods when bone can change faster, including the menopausal transition or substantial weight loss. Mechanical loading stimulates bone adaptation, while nutrition, hormones, medications, illness, and metabolism also influence the ongoing balance between bone formation and bone resorption. A repeatable measurement helps make that otherwise invisible process more visible.
What a risk estimate does not replace
Five-year fracture risk is one part of a broader clinical picture. It does not replace a medical history, evaluation of previous fractures, assessment of fall risk, laboratory testing when indicated, or the judgment of a qualified clinician.
It also should not be used to label a person as safe or unsafe. Risk exists on a continuum, and the same result can carry different implications depending on age, prior fracture history, medical conditions, medication exposure, and the decisions in front of you.
The most useful way to view the result is as better information, not a verdict. A MobileREMS assessment provides density, an independent Fragility Score, and an estimated five-year fracture risk in a report you can review with your physician. Together, those measures can make the invisible biology of bone more understandable before consequences force the conversation.
Your bones do not need to become an emergency before they become worth measuring. Knowing what density shows, what it misses, and how fragility information changes the picture gives you a clearer place to begin.