
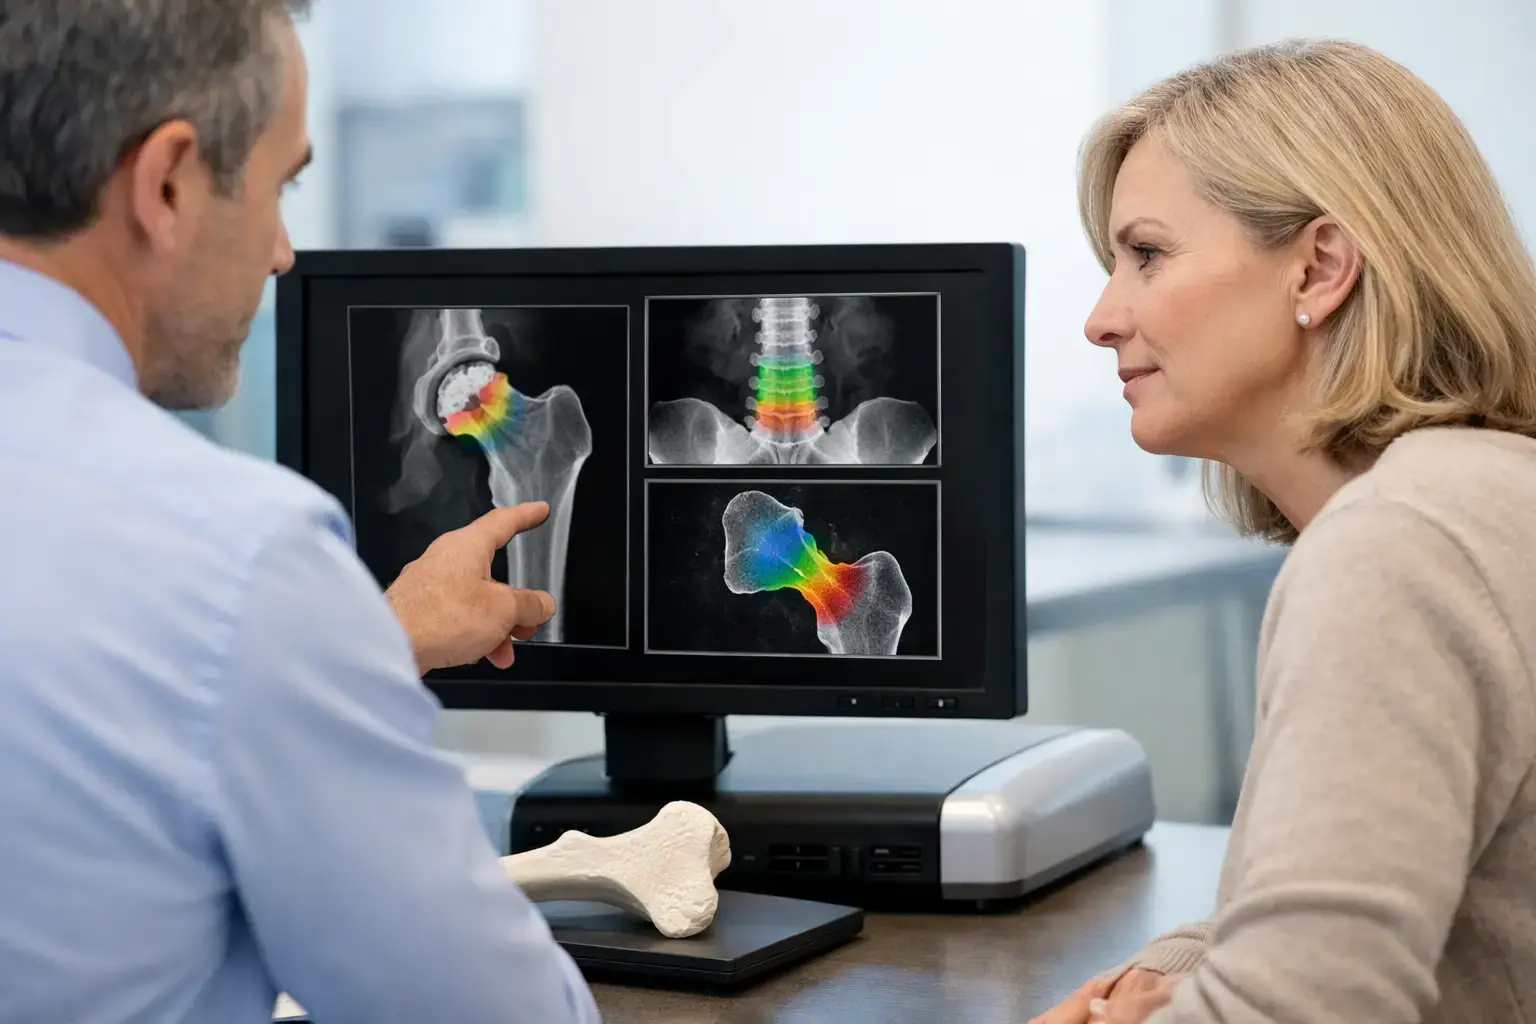
A normal-looking density result can be reassuring, but it is not the same thing as a low-risk result. If you are trying to review fracture risk because of menopause, type 2 diabetes, osteopenia, medication exposure, or simple curiosity about your long-term health, the question is larger than one T-score: how much mineralized bone is present, and what signs of fragility does that bone show?
Fractures are often treated as sudden events. Biologically, they are usually the first visible consequence of changes that have been developing quietly. The goal of a bone-health assessment is not to predict every fall or create fear around movement. It is to make skeletal information available before a fracture becomes the first data point.
What it means to review fracture risk
Fracture risk is an estimate, not a verdict. It describes the likelihood of a fracture over a defined period based on the information included in the assessment. That distinction matters. A risk estimate cannot tell you whether you will fall, the force of a particular fall, or every factor affecting your health. It can, however, put meaningful structure around a question that a density number alone cannot fully answer.
Bone mineral density, or BMD, measures how much mineralized bone is present at tested sites, commonly the lumbar spine and proximal femur. It is valuable information. Low density is associated with higher fracture risk, which is why BMD remains central to bone assessment.
But density is not the whole biology of a fracture. Bone can have similar mineral density while showing different signal patterns associated with fragility. Think of two people whose reports show a similar density value. One may have a lower Fragility Score, while the other has a higher score and a different estimated five-year fracture risk. The mineral quantity may look comparable. The broader picture is not necessarily the same.
That is the gap a thoughtful fracture-risk review is meant to address.
Why density can miss part of the story
The clearest example is type 2 diabetes. People with type 2 diabetes may have bone density that is normal or even higher than expected, yet their fracture risk can still be elevated. This pattern has been observed across large studies and is one reason density should not be interpreted in isolation for this population.
The mechanism is still being studied, but it is not a contradiction. Bone density describes mineral quantity, not every biological feature associated with skeletal fragility. Diabetes can affect bone turnover and the bone environment through factors such as chronic hyperglycemia and changes in collagen quality. Falls, neuropathy, vision changes, and some diabetes treatments may also affect fracture risk independently of density.
Other situations can also make a density-only result incomplete. Long-term glucocorticoid exposure can alter bone remodeling. Cancer treatments may affect hormonal pathways and bone turnover. Rapid weight loss can change mechanical loading and nutritional status. During perimenopause and menopause, declining estrogen can accelerate bone loss at a time when many people have never had a baseline assessment.
None of these circumstances makes a density result irrelevant. They make context essential. A strong review asks what the density says, what it does not say, and whether the rest of the clinical picture points toward a closer look.
What REMS adds to a fracture-risk review
REMS, or Radiofrequency Echographic Multi Spectrometry, uses radiation-free ultrasound to measure bone mineral density at the lumbar spine and proximal femur. It then analyzes raw ultrasound signals reflected from the bone to derive an independent Fragility Score.
The distinction is important. The Fragility Score is not another way of restating density. It reflects signal characteristics associated with fragility that density alone does not capture. REMS then weighs density and the Fragility Score together to estimate fracture risk over the next five years.
This gives you three related but distinct pieces of information: bone mineral density, an independent Fragility Score, and an estimated five-year fracture risk. Each answers a different question. Density addresses how much mineralized bone is present. The Fragility Score addresses whether the reflected signal shows signs associated with greater fragility. The fracture-risk estimate brings those measures together into a time-based view.
That does not mean a scan replaces medical history, laboratory testing, fall history, medication review, or clinical judgment. It means the conversation can begin with more than a single number.
The value of following change over time
Precision matters when monitoring bones because bone change is often gradual. If measurement variability is too large, a small difference between scans may be machine noise rather than a biological change.
REMS has an intra-operator precision error below 0.5%. For context, typical reported DXA precision error at the spine is often in the range of 0.9% to 1.9%. The numbers are technical, but their practical meaning is straightforward: tighter precision supports the ability to re-measure over shorter intervals and have greater confidence that a meaningful change on a report reflects something real.
This can be particularly useful when you are establishing a baseline before a bone-related decision, tracking skeletal health during a period of rapid body change, or trying to understand whether a known risk factor is reflected in measurable bone information. A single scan is a snapshot. Consistent measurement can turn snapshots into a trend.
How to read the information without overreading it
A good report should clarify, not overwhelm. Start by separating the three outputs rather than looking for one number to settle every question.
Your density result may be reported as a T-score, which compares your BMD with the average BMD of a healthy young adult reference population. A Z-score compares your result with people of a similar age and sex. These comparisons serve different clinical purposes, and their meaning depends on your life stage and medical context.
The Fragility Score adds separate information from the ultrasound signal. A higher score indicates more signal features associated with fragility, but it does not diagnose the cause of those features or define your overall health on its own. It is a measurement that becomes more useful when read alongside density and your clinical history.
The estimated five-year fracture risk is the integrative output. It is not a guarantee that a fracture will or will not happen. Rather, it gives you and your clinician a clearer basis for discussing the information available now, especially when density alone seems reassuring but your risk factors are not.
For someone with osteopenia or osteoporosis, this can bring needed nuance. A label based on density is meaningful, but it may not fully describe the current fragility picture. For a prevention-focused person whose density is still in a favorable range, a baseline can provide information that is otherwise invisible. Both situations are about understanding, not self-diagnosing.
Questions that make a fracture-risk review more useful
The most useful next conversation is often specific. You might ask how your density and Fragility Score relate to one another, whether your five-year risk estimate fits with your health history, and whether future measurements would be useful for tracking change.
If you have type 2 diabetes, have used glucocorticoids, are approaching or moving through menopause, have a cancer-treatment history, or are experiencing rapid weight change, name that context. It may affect how a clinician interprets a result. If you are considering an orthopedic procedure or discussing osteoporosis treatment, objective bone information can also give your care team a more complete starting point.
MobileREMS provides a report designed to be understandable to you and useful to the physician or clinician involved in your care. The purpose is not to turn every result into a problem. It is to replace an avoidable blind spot with information you can follow.
Your bones do not need to be a mystery until something breaks. A clear view of density, fragility-related signals, and estimated fracture risk gives you a more informed place to begin the conversation.