
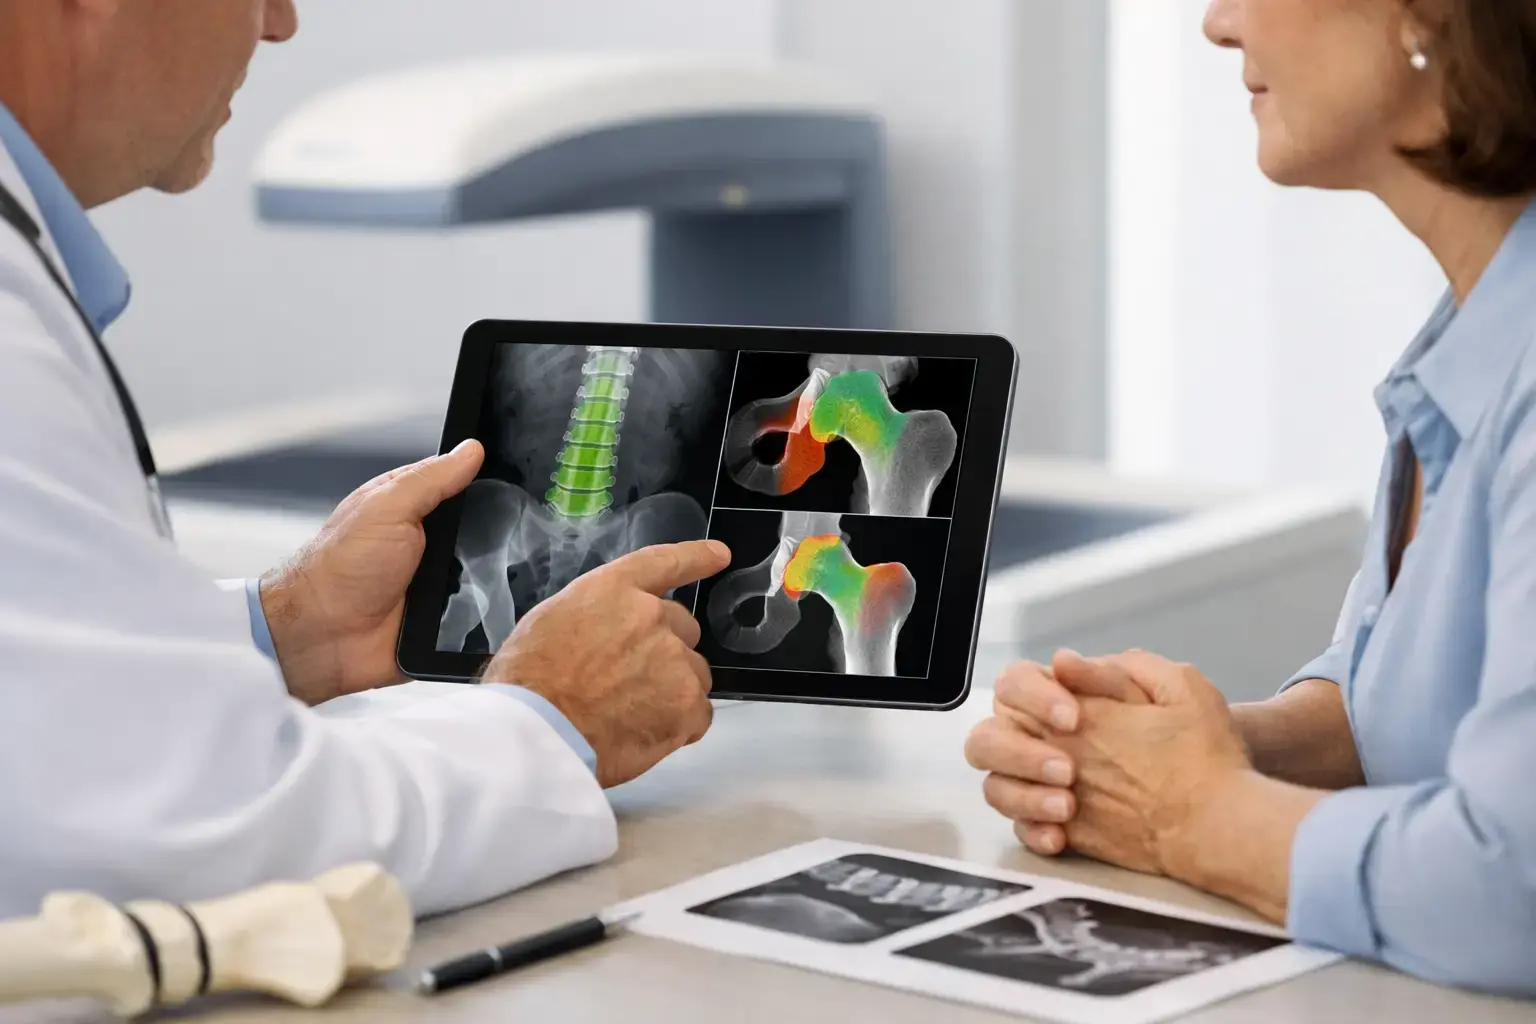
A bone density result can look deceptively simple: one number, one category, perhaps a reassuring or concerning label. But if you are trying to understand bone density results after menopause, with osteopenia, or because of a risk factor such as type 2 diabetes, the real question is larger than whether your score is normal.
Bone mineral density tells you how much mineralized bone is present in the area measured. That information matters. It does not, by itself, explain all of the factors associated with skeletal fragility or tell the full story of whether a fracture is likely in the years ahead.
Start With the Measurement, Not the Category
A bone density test measures bone mineral density, often abbreviated BMD. The result is commonly reported in grams per square centimeter, usually at the lumbar spine and hip. These sites matter because they are common locations for clinically significant fractures and because they provide useful information about changes over time.
Most people do not need to focus on the raw BMD number first. It becomes most useful when compared with a reference population, which is what produces the T-score and Z-score on many reports.
What a T-score means
A T-score compares your bone mineral density with the average density of a healthy young adult of the same sex, near the age when peak bone mass is expected. The score is expressed in standard deviations above or below that reference average.
For postmenopausal women and men age 50 and older, the standard diagnostic categories are generally:
- A T-score of -1.0 or higher is classified as normal bone density.
- A T-score between -1.0 and -2.5 is classified as low bone mass, often called osteopenia.
- A T-score of -2.5 or lower is classified as osteoporosis.
The more negative the T-score, the lower the measured bone mineral density relative to that young-adult reference. A T-score of -2.0 is lower than -1.0, but it is not a countdown clock and does not predict a specific outcome on its own.
The categories are clinically useful because they create a common language for diagnosis and follow-up. Still, they should not be mistaken for complete risk categories. Two people with the same T-score can have meaningfully different fracture risk.
What a Z-score means
A Z-score compares your density with people of the same age, sex, and, in many reports, similar body size or ethnicity. It answers a different question: how does your result compare with peers?
Z-scores are especially relevant for premenopausal women, men younger than 50, and children. A Z-score at or below -2.0 is often described as below the expected range for age. It is a signal to consider the broader clinical context, not a diagnosis of osteoporosis by itself.
A result can be lower than you expected without revealing why. Genetics strongly influences the peak bone mass you built earlier in life. Hormonal changes, certain medications, chronic conditions, nutrition, body weight changes, and physical activity can all affect bone over time. A report cannot determine the cause alone.
How to Understand Bone Density Results in Context
The most useful interpretation begins with three questions: How much mineralized bone is present? Is the result changing over time? And does density reflect the whole fracture-risk picture for this person?
A single scan is a baseline, not a biography of your skeleton. It shows where you are at that moment. A prior study, performed at the same anatomical site and with sufficiently precise measurement, can help show whether density is stable, increasing, or declining.
That distinction matters because small numerical differences are not always biological changes. Every measurement has some degree of precision error. If a scan changes by less than the precision threshold of the method and testing process, the difference may reflect measurement variability rather than a real change in bone.
The clinical significance of a result also depends on factors outside the scan. Age, prior fractures from low-trauma events, family history, smoking, alcohol exposure, falls, medication history, and conditions that affect bone metabolism all contribute to fracture risk. A physician considers these alongside imaging results, not after them.
Why a Normal Density Score Can Still Miss Fragility
Bone density is necessary information, but it is not synonymous with bone strength. Density describes the amount of mineralized bone measured. It does not directly describe every structural signal associated with fragility.
Type 2 diabetes is the clearest example of why this distinction matters. People with type 2 diabetes can have bone density that appears normal or even higher than average while still having elevated fracture risk. The biology is complex: changes associated with long-term glucose exposure, bone turnover, falls, and other metabolic factors may contribute. The practical point is straightforward: a reassuring density category does not automatically equal reassuring fracture risk.
The same need for context can arise with long-term glucocorticoid use, cancer-treatment history, rapid weight loss, or other circumstances that can affect skeletal health. Density remains worth measuring. It simply should not be asked to answer questions it was not designed to answer alone.
Picture two people whose hip density produces the same T-score. One may have no fracture history and few additional risk factors. The other may have type 2 diabetes, a prior low-trauma fracture, or ultrasound signals associated with greater fragility. Their density number is similar; their overall risk picture may not be.
What REMS Adds Beyond Bone Mineral Density
REMS, or Radiofrequency Echographic Multi Spectrometry, measures bone mineral density at the lumbar spine and proximal femur using radiation-free ultrasound. It also analyzes raw ultrasound signals reflected from the bone to derive an independent Fragility Score.
The Fragility Score is not another name for density. It reflects ultrasound signal characteristics associated with skeletal fragility that bone mineral density alone does not capture. It should not be interpreted as a direct measurement of bone flexibility, microarchitecture, failure load, or brittleness. Those are distinct concepts and measurements.
By weighing density together with the Fragility Score, REMS can estimate five-year fracture risk. This gives you three related but different pieces of information: measured density, signs associated with fragility, and an estimate of what those findings may mean for fracture risk over the next five years.
That distinction can make a report more understandable. A low density result may be accompanied by a Fragility Score and risk estimate that add useful context. Conversely, density in a normal range may deserve a closer look if the Fragility Score or broader clinical history points toward greater concern.
MobileREMS uses FDA-cleared REMS technology, which is radiation-free and has reported intra-operator precision error below 0.5%. Precision is not a technical detail reserved for the equipment manual. It affects whether a change seen on repeat testing is more likely to reflect a real change in your bones rather than ordinary measurement noise.
Questions Worth Bringing to Your Appointment
Your report is most useful when it leads to a better conversation, not when it becomes a label you carry alone. If you are reviewing results with a clinician, ask which sites were measured, whether T-scores or Z-scores are most relevant for your age and circumstances, and whether prior scans can be compared reliably.
It is also reasonable to ask how your personal history changes the meaning of the density result. A prior fracture, menopause transition, diabetes, medication exposure, recent weight change, or planned orthopedic procedure can all alter the questions worth asking.
If your assessment includes REMS, ask how the Fragility Score relates to your density result and how both contribute to the estimated five-year fracture risk. The goal is not to search for one perfect number. It is to understand what each measure contributes and where uncertainty remains.
Your bones are changing tissue, not a permanent scorecard. A clear baseline and a precise way to follow it can make the invisible visible before a fracture is forced to tell the story.