
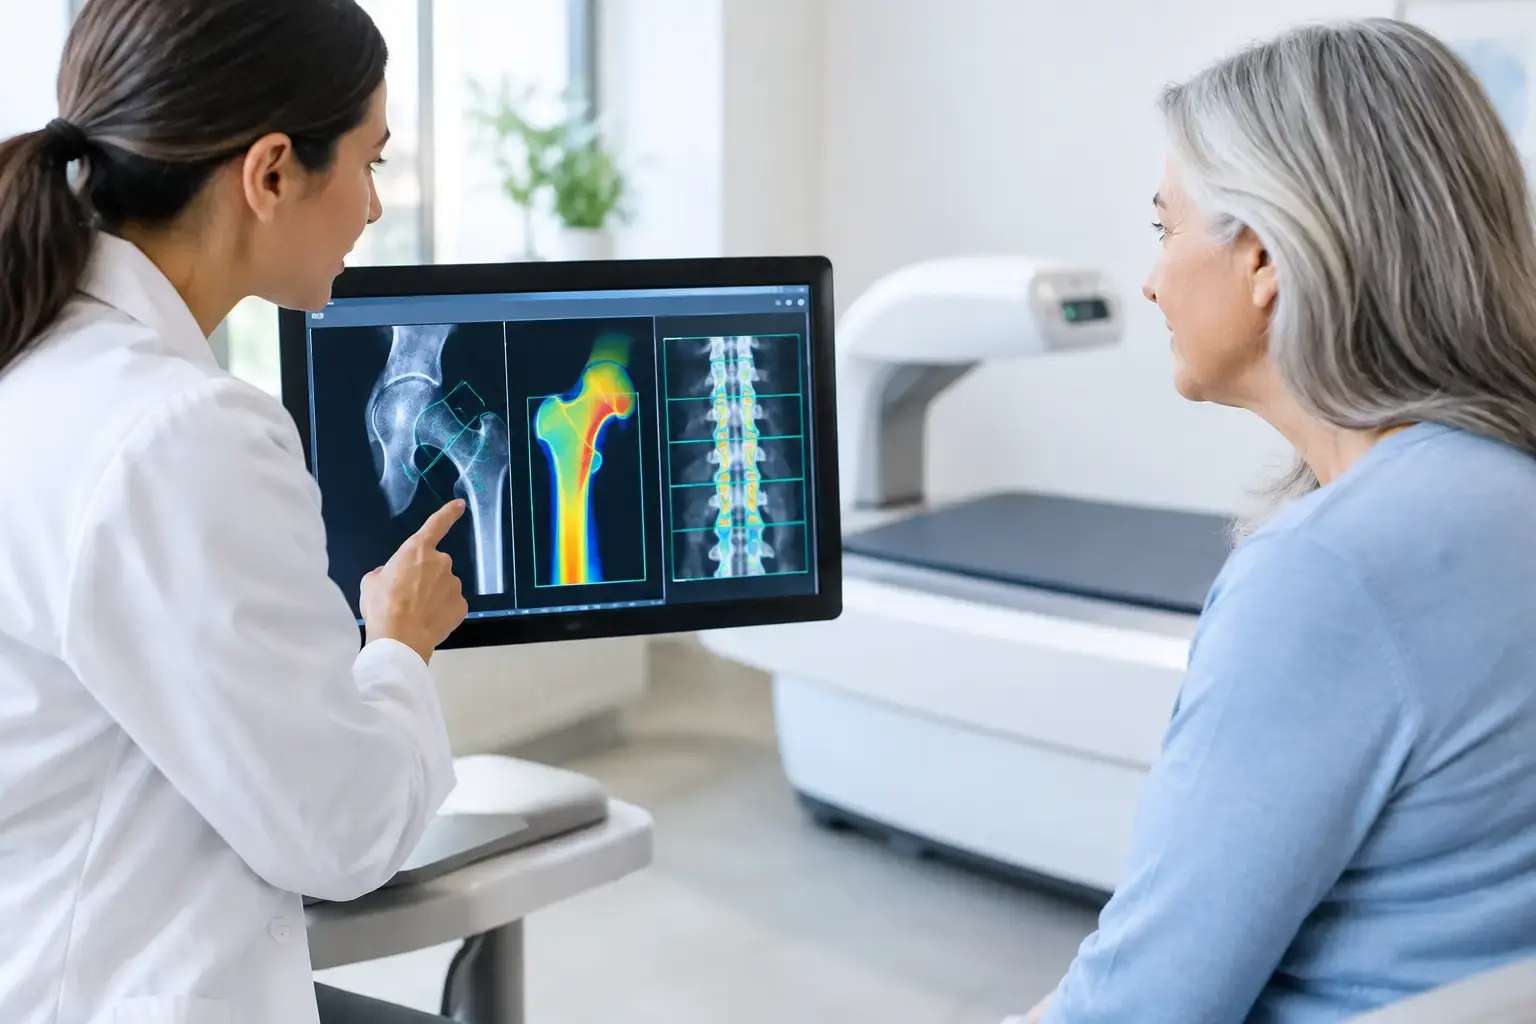
A normal bone-density result can be falsely reassuring when you have type 2 diabetes. That is why the best diabetic bone metrics do not stop at bone mineral density, or BMD. Diabetes can raise fracture risk even when density appears normal or, in some cases, higher than expected.
This is not a reason to fear your bones. It is a reason to ask a better question: beyond how much mineralized bone is present, what information describes whether your bones are showing signs associated with fragility?
Why diabetes changes the bone-health conversation
Type 2 diabetes is one of the clearest examples of the limits of density alone. Large observational studies have consistently found that people with type 2 diabetes experience more fractures than their BMD results alone would predict. In practical terms, two people may receive similar density scores, yet the person with diabetes may carry a meaningfully different fracture risk.
The mechanism is still an active area of research, but several pathways are biologically plausible and supported by evidence. Chronic elevated glucose can contribute to advanced glycation end products, often called AGEs. These compounds can accumulate in collagen, the protein framework within bone. Bone mineral gives the skeleton much of its stiffness; collagen contributes to the underlying matrix that helps bone tolerate everyday forces. Changes in that matrix may matter even when the quantity of mineralized bone does not look low.
Diabetes can also affect bone turnover, circulation, inflammation, nerve function, vision, and balance. Some of those factors influence the likelihood of a fall. Others may influence bone biology itself. The point is not that every person with diabetes has fragile bones. It is that a density number, by itself, may leave out information that matters.
The best diabetic bone metrics answer different questions
There is no single number that fully describes skeletal health. A useful assessment separates related questions rather than forcing one measurement to do all the work.
Bone mineral density: How much mineralized bone is present?
BMD remains a foundational measurement. It is used to classify bone status and is central to osteoporosis evaluation. Low density is associated with higher fracture risk, and tracking density over time can show whether mineralized bone is changing.
But BMD measures quantity, not every feature that contributes to fragility. Think of two shelves made with the same amount of wood. One may be structurally sound; the other may contain subtle changes that affect how it performs under load. The comparison is not a claim that a scan sees every structural feature of bone. It illustrates why equal amounts of material do not always mean equal real-world performance.
For someone with diabetes, density is still valuable. It simply should not be treated as the entire story.
Fragility information: Is the bone signal associated with greater fragility?
REMS, or Radiofrequency Echographic Multi Spectrometry, measures BMD at the lumbar spine and proximal femur using radiation-free ultrasound. It also analyzes the raw ultrasound signals reflected from bone to derive an independent Fragility Score.
That distinction matters. The Fragility Score is not another way of restating density, and it is not a direct measurement of bone flexibility, microarchitecture, brittleness, or failure load. It reflects signal characteristics associated with skeletal fragility that density alone does not capture.
For a person whose diabetes creates a possible mismatch between density and fracture risk, this additional information can be especially relevant. A normal density result may remain reassuring in one sense, while a Fragility Score provides another lens on the condition of the bone signal. Or the two measures may tell a consistent story. Either outcome is more informative than assuming density answers every question.
Estimated fracture risk: What might the numbers mean together?
Risk estimation is the third useful metric. REMS weighs BMD and the independent Fragility Score together to estimate five-year fracture risk. This takes the conversation from a classification label toward a question that is easier to use: given the information available now, what does it suggest about the likelihood of fracture over the next several years?
No risk estimate predicts an individual future with certainty. Fractures are influenced by many factors, including age, prior fractures, medications, falls, other medical conditions, and changes in health over time. A risk estimate is best understood as decision-quality information to discuss with a clinician, not a verdict.
Why common fracture tools may need context in diabetes
Clinical fracture-risk tools have been valuable because they combine density with factors such as age, smoking history, glucocorticoid exposure, and prior fracture. Yet type 2 diabetes has historically not been fully represented as an independent input in some widely used models.
That can create an underestimation problem. A person may have a calculated risk that looks modest because their density is normal, while the diabetes-related contribution to fracture risk is not fully reflected. Clinicians sometimes account for this through broader clinical judgment or adjustments based on an individual's history. The right interpretation depends on the person, their diabetes history, medications, complications, fall history, and other risks.
This is precisely where more direct bone information can help. It does not replace clinical assessment. It gives that assessment another objective data point.
What to look for in a diabetic bone assessment
The best diabetic bone metrics are not necessarily the most numerous. They are the measurements that clarify the gap between a reassuring-looking density result and the broader question of fragility.
A useful report includes BMD at clinically relevant sites, an independent measure of fragility information, and an understandable fracture-risk estimate. It should also be precise enough to support follow-up measurement. If a test cannot distinguish a real change from ordinary measurement variation, frequent monitoring creates more confusion than clarity.
REMS has an intra-operator precision error below 0.5%, compared with the approximately 0.9% to 1.9% precision error commonly reported for DXA at the spine. Low measurement error is not merely a technical advantage. It affects whether a difference between two reports is likely to represent a meaningful change in bone rather than noise from positioning or the instrument.
Because REMS is radiation-free, it also makes repeat assessment possible without adding ionizing-radiation exposure. That may be relevant when bone status is being monitored during a period of rapid health change, such as significant weight loss, changes in diabetes treatment, or a new osteoporosis evaluation. The appropriate timing for repeat measurement is a clinical decision shaped by the reason for monitoring and the change one is trying to detect.
A more complete conversation to have with your clinician
If you have type 2 diabetes, a productive bone-health conversation does not begin and end with, “Is my density normal?” It can include whether your current assessment reflects diabetes as a fracture-risk context, whether you have other contributors to risk, and whether information beyond BMD would make the picture clearer.
Bring the actual report when possible, not just a verbal summary. Ask which skeletal sites were measured, how the result compares with prior measurements, and what the numbers can and cannot establish. If your density is normal but you have diabetes, that result is useful information. It is not a reason to assume there is nothing more to learn.
Your bones are living tissue, quietly adapting and changing long before a fracture makes them impossible to ignore. Better measurement does not create risk. It makes the information already present more visible, so you and your care team can have the conversation before consequences force it.