
A bone density result can look reassuring and still leave an unanswered question: how fragile is the bone itself? That gap is why people search for bone density alternatives. Often, they are not looking to discard density. They want to know what else can reveal risk before a fracture does.
Bone mineral density remains a central part of skeletal assessment. It measures how much mineralized bone is present, usually at the spine and hip. But bone strength is not a single measurement. Two people may have similar density results while carrying meaningfully different fracture risk. The difference may be visible in information that density alone does not provide.
Why density is useful, but incomplete
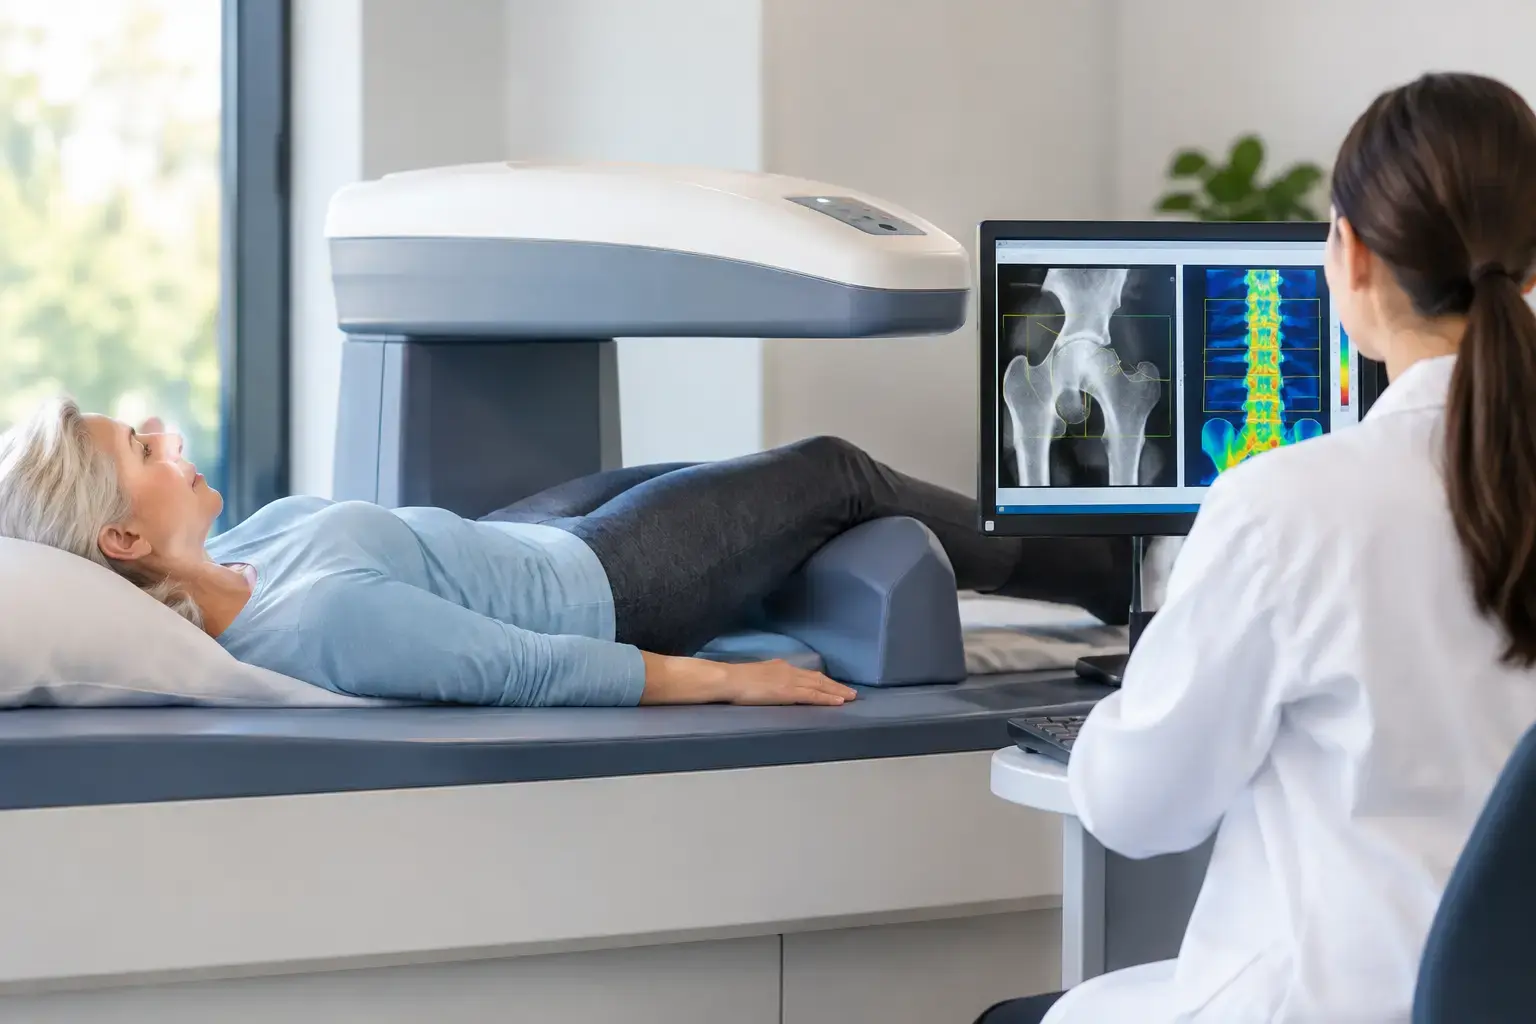
A DXA scan has long been the standard test for measuring bone mineral density. It produces T-scores and Z-scores that help clinicians identify osteoporosis, osteopenia, or bone density that falls within an expected range. Those numbers matter. Lower density is associated with higher fracture risk, and DXA remains deeply embedded in clinical guidelines and treatment decisions.
The limitation is not that density is wrong. It is that density is one dimension of a more complicated biological picture.
Bone is living tissue that continuously remodels. Its ability to resist fracture reflects mineral content, but also the condition of the tissue and structural characteristics associated with fragility. A density measurement tells you how much mineralized bone is present. It does not independently assess whether the reflected characteristics of that bone suggest greater fragility.
Type 2 diabetes makes this limitation especially clear. People with type 2 diabetes can have bone density that appears normal, or even higher than expected, while fracture risk remains elevated. Several mechanisms may contribute, including changes in bone material properties related to chronic high blood sugar and complications that increase fall risk. A normal density result in this setting should not automatically be read as a complete risk assessment.
The same need for context can arise with long-term glucocorticoid use, cancer-treatment history, rapid weight loss, and during the menopause transition, when bone loss can accelerate before routine screening commonly begins.
Bone density alternatives are not all measuring the same thing
The phrase “bone density alternatives” suggests a single replacement test. In practice, different methods answer different questions. The useful question is not which test is best in every situation. It is: what information is missing, and which method can meaningfully add it?
Quantitative CT and opportunistic CT
Quantitative computed tomography, or QCT, can measure volumetric bone density. Unlike the areal density reported by DXA, it can distinguish between compartments such as trabecular and cortical bone in certain applications. This can be useful in selected clinical situations, particularly when body size, spinal degeneration, or other factors may complicate interpretation of a standard DXA result.
CT-based approaches involve ionizing radiation, although the amount varies by protocol. They are also not necessarily available as a routine bone-health assessment in every setting. Opportunistic CT analysis, which derives bone information from a scan obtained for another medical reason, is an active and promising area, but it depends on having an appropriate CT image in the first place.
Trabecular bone score
Trabecular bone score, often called TBS, is not a separate scan. It is software analysis applied to a DXA image of the lumbar spine. It evaluates patterns of gray-level texture in that image and can add information to fracture-risk assessment beyond density alone.
TBS may be particularly useful when a clinician is trying to refine risk in someone whose density does not tell the full story. It does not replace bone density, and it does not provide a direct measure of bone microarchitecture. Its value is in adding another layer of risk-related information to the DXA result.
Fracture-risk calculators
Clinical fracture-risk tools combine factors such as age, prior fracture, family history, smoking, certain medications, and sometimes bone density. They are valuable because fractures are not caused by bone measurements alone. Falls, health conditions, and medical history also matter.
A calculator can estimate risk without a density result, but it cannot see your bone directly. Its estimate is only as complete as the risk factors it includes. This is why a risk calculation and a bone assessment are often complementary rather than competing approaches.
Bone turnover markers
Blood or urine markers of bone turnover reflect biochemical activity involved in bone formation and resorption. They can help show whether remodeling activity is relatively high or low at a given time and may be useful in specific clinical monitoring contexts.
They do not measure bone density, and they do not directly estimate fracture risk. Results can also vary with timing, recent food intake, illness, and laboratory methods. They answer a different question: what is bone remodeling doing right now?
Where REMS fits among bone density alternatives
Radiofrequency echographic multi-spectrometry, or REMS, is a radiation-free ultrasound-based technology that measures bone mineral density at the lumbar spine and proximal femur. In that respect, it provides density information at the same clinically important sites commonly assessed by DXA.
What makes REMS distinct is what happens beyond the density measurement. The technology analyzes raw ultrasound signals reflected from bone to derive an independent Fragility Score. That score reflects signal characteristics associated with skeletal fragility that density alone does not capture.
REMS then weighs bone mineral density and the Fragility Score together to estimate five-year fracture risk. Rather than asking you to choose between “how much bone do I have?” and “does that bone show signs of greater fragility?”, the assessment addresses both questions.
Picture two people with the same bone density at the hip. Density alone places them in the same category. If their Fragility Scores differ, their overall picture may differ too. That does not mean one result overrides the other. It means the measurement has moved beyond a single number and toward a more complete estimate of risk.
MobileREMS uses Echolight REMS technology to provide these three outputs: bone mineral density, Fragility Score, and estimated five-year fracture risk. The report is designed to be understandable to you and useful in a conversation with your physician.
Precision changes what monitoring can mean
The usefulness of repeat bone testing depends on measurement precision. Every test has some degree of variability. If the expected change in bone is smaller than the noise of the measurement, a new result may not tell you whether your bones truly changed.
REMS has an intra-operator precision error below 0.5%, compared with the 0.9% to 1.9% typically reported for DXA at the spine. That difference is not merely technical. Tighter precision can make it more feasible to re-measure over shorter intervals and interpret whether a difference is likely to be real rather than ordinary measurement variation.
This may matter to someone entering menopause, monitoring bone health during substantial weight change, or establishing a baseline before a bone-related medical decision. It also matters to people who already know they have osteopenia or osteoporosis and want more information than a T-score can provide.
Precision does not turn any scan into a prediction of exactly what will happen to one person. Fractures remain influenced by falls, medications, health conditions, age, and factors no imaging test can fully capture. But better measurement can reduce uncertainty where uncertainty is avoidable.
Choosing the information that answers your actual question
There is no universal need to replace DXA, CT, laboratory testing, or clinical risk assessment with another method. Each can be appropriate in the right context. A person with a prior fragility fracture may need a different clinical conversation than someone in their late forties who wants an earlier baseline. Someone with type 2 diabetes may benefit from a more careful interpretation of a normal density result than someone without that risk factor.
The practical shift is to stop treating density as the entire story. Bone mineral density tells you how much mineralized bone is present. Other tools can add information about clinical risk, remodeling activity, CT-based density, or texture patterns. REMS adds an independent Fragility Score from reflected ultrasound signals and combines it with density to estimate five-year fracture risk.
Your bones should not become visible only after an injury makes them impossible to ignore. Better information does not create fear. It gives you a clearer starting point for the conversations and decisions that belong in your care.