
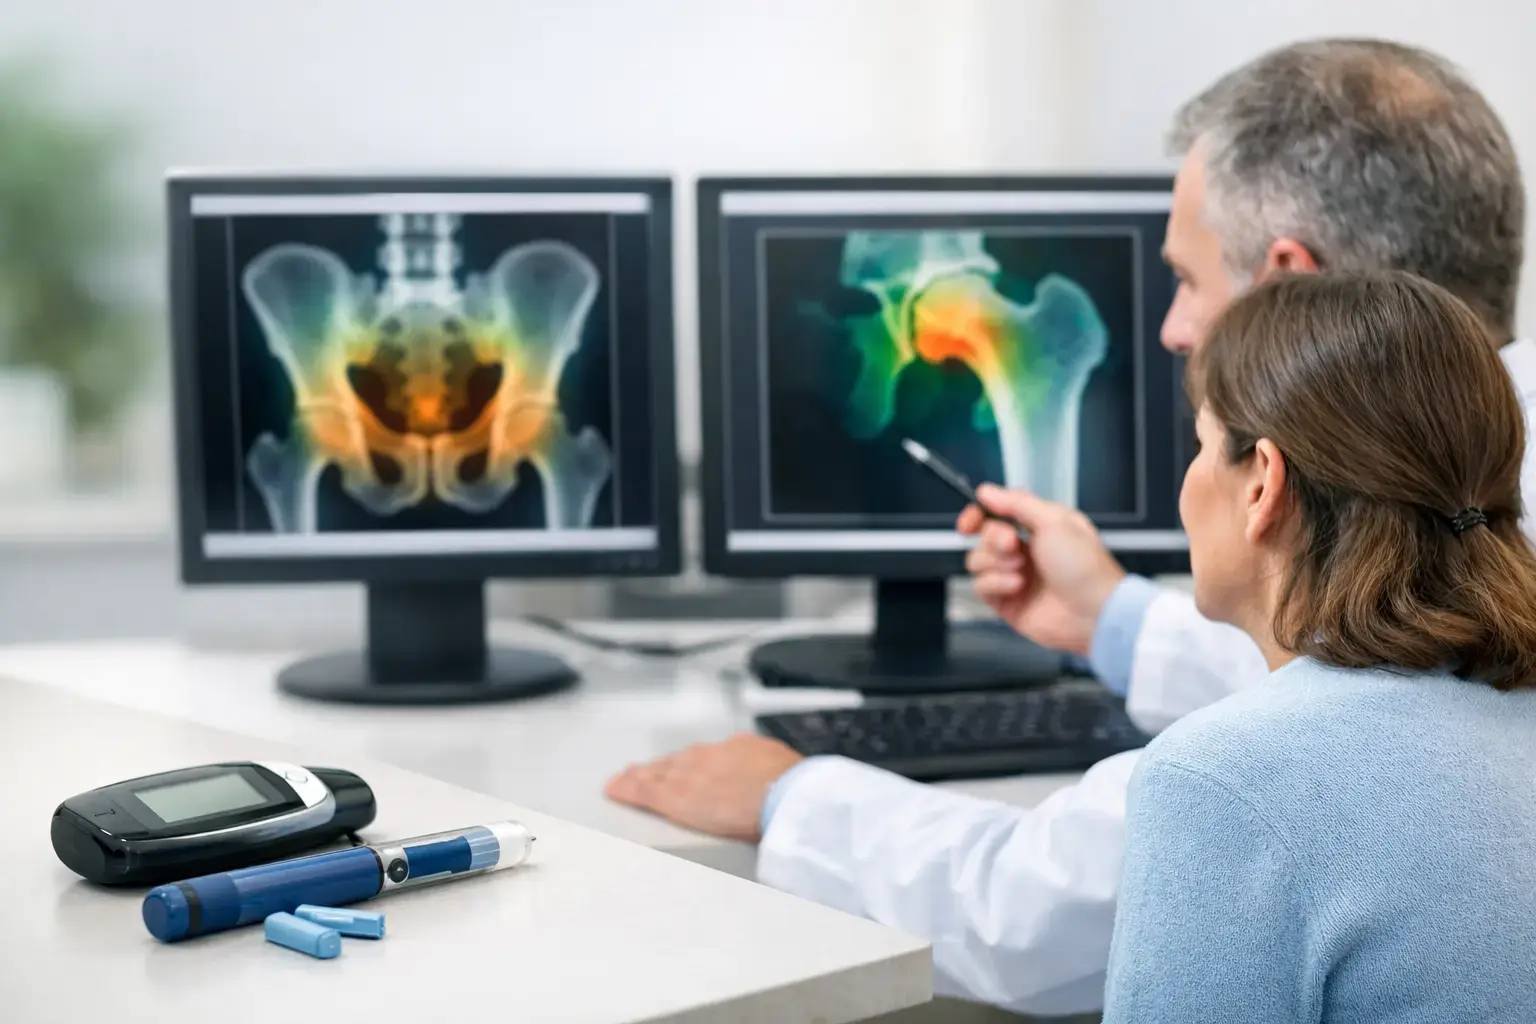
A normal bone-density result can be falsely reassuring when you have type 2 diabetes. Research has repeatedly found that fracture risk may be higher in type 2 diabetes even when bone mineral density is normal or higher than expected. That is the reason a diabetes bone health planning guide needs to start with a question larger than, “What is my density?” It needs to ask whether the available information reflects your actual risk of a fragile bone breaking.
The gap is biological, not a failure of attention. Diabetes affects more than blood glucose. Over time, it can affect collagen within bone, the small blood vessels that support skeletal tissue, muscle function, vision, balance, and the likelihood of a fall. None of that means a fracture is inevitable. It does mean that bone health deserves the same deliberate planning many people already bring to glucose, blood pressure, kidney function, and cardiovascular risk.
Why diabetes can change the bone-risk picture
Bone mineral density, or BMD, measures how much mineralized bone is present. It remains a valuable measurement. But density does not capture every feature associated with skeletal fragility, and type 2 diabetes is one of the clearest examples of why that distinction matters.
In the Rotterdam Study and other large observational studies, people with type 2 diabetes have shown higher fracture risk despite average BMD that is often normal or elevated. The reasons are still being clarified, but several mechanisms are plausible and supported by current evidence.
One is the accumulation of advanced glycation end products, commonly called AGEs. When glucose remains elevated over time, sugars can bind to proteins, including collagen. Collagen is part of bone's organic matrix - the framework within which mineral is deposited. Glycation can alter collagen cross-linking. A density scan may still show substantial mineralized bone, while the underlying tissue may not behave in quite the same way under stress.
Diabetes can also increase fracture risk through factors outside bone itself. Peripheral neuropathy may affect sensation and gait. Vision changes, low blood glucose episodes for people using certain medications, reduced muscle strength, and some diabetes complications can increase fall risk. A fracture happens when skeletal strength and the force of a fall meet at the wrong moment. A useful plan considers both sides of that equation.
This is why two people can have similar BMD results and still need different conversations about fracture risk. Density tells you how much mineralized bone is present. It does not independently describe all the signals associated with fragility or account for every fall-related factor that may matter in diabetes.
What a diabetes bone health planning guide should include
Planning is not the same as self-diagnosis. It is a way to organize the information your clinician may need to assess your situation clearly, particularly if a standard density result does not seem to match your overall risk profile.
Start with your diabetes and fracture context
Bring together the details that connect metabolic health with skeletal health: diabetes type, duration, glucose history, medication history, kidney function, vision or nerve symptoms, prior falls, and any fracture after a low-impact event. A low-impact fracture generally means one that occurred from a fall from standing height or less, rather than a major trauma.
Also include factors that can influence bone independently of diabetes. Menopause status, family history of hip fracture, smoking, alcohol exposure, inflammatory conditions, digestive disorders that affect nutrient absorption, thyroid or parathyroid disease, and long-term glucocorticoid use can all change the assessment. So can a history of cancer treatment or rapid weight loss.
The goal is not to turn every risk factor into a prediction. It is to make sure a density number is interpreted in its proper clinical context.
Know which measurements answer which questions
A conventional density assessment gives a BMD value, often reported with a T-score or Z-score. A T-score compares bone density with the average young adult reference population. A Z-score compares it with people of the same age and sex. These numbers can help identify low bone mass and osteoporosis, but they are not direct measurements of whether bone is showing greater fragility.
REMS, or Radiofrequency Echographic Multi Spectrometry, adds a different layer of information. It uses radiation-free ultrasound to measure BMD at the lumbar spine and proximal femur. It also analyzes raw ultrasound signals reflected from bone to derive an independent Fragility Score. That score reflects signals associated with fragility beyond density alone.
REMS then weighs density and Fragility Score together to estimate five-year fracture risk. The distinction is practical: you leave with three understandable measures to follow over time - BMD, Fragility Score, and estimated five-year fracture risk.
This does not make any single test a complete answer. Fracture risk is influenced by clinical history, medications, falls, and conditions such as diabetes. But when density may understate concern, information about fragility can make the conversation more proportionate to the biology.
Establish a baseline before a decision forces one
Many people first think about their bones after a fracture, an osteoporosis diagnosis, or a major treatment decision. Earlier information can be more useful because it gives you something to compare against as your health changes.
For an adult with diabetes, a baseline may be especially relevant during transitions: the menopause transition, a period of substantial weight loss, a change in diabetes treatment, the start of medication that can affect bone, or preparation for orthopedic surgery. The appropriate timing and type of assessment depend on your age, medical history, and clinician's judgment. The principle is straightforward: a baseline is most useful before the question becomes urgent.
Precision matters when monitoring is part of the plan. MobileREMS uses FDA-cleared, radiation-free REMS technology with reported intra-operator precision error below 0.5%. Lower measurement error matters because it can help distinguish a meaningful change from ordinary test variability. That creates the possibility of following changes over months rather than assuming bone information only belongs on a years-long schedule.
Questions worth bringing to your clinician
A productive bone-health conversation does not require you to arrive with answers. It helps to arrive with the right questions. You might ask whether diabetes changes how your fracture risk should be interpreted, whether your current medications or complications affect falls or bone, and whether a density-only result gives enough information for your situation.
If you already have a BMD report, ask what it does and does not show. If your density is normal, ask whether that finding is consistent with your broader health history. If you have osteopenia or osteoporosis, ask how your fracture history, diabetes status, and any available fragility information change the picture.
The discussion may also include general contributors to bone metabolism. Mechanical loading signals bone to adapt, while vitamin D, calcium balance, protein intake, hormones, kidney function, and inflammation all play roles in bone remodeling. These are not interchangeable levers, and no single behavior or supplement can be assumed to resolve an individual's fracture risk. The value of an assessment is that it gives those conversations a factual starting point.
Keep the record useful over time
Bone planning works best when your results are easy to retrieve and compare. Keep copies of imaging reports, fracture-risk estimates, relevant lab results, medication changes, and records of falls or fractures. Note the date, the site measured, and the method used. Comparing results from different technologies or anatomical sites can be useful clinically, but it is not always a direct apples-to-apples comparison.
If monitoring is repeated, consistency helps. Similar measurement sites, clear documentation, and interpretation alongside changes in health status make the trend more meaningful. A result is not a verdict on your future. It is a piece of evidence that becomes more useful when viewed over time.
Diabetes management is already a long-term practice of making invisible processes visible. Your bones deserve that same clarity: not fear, not assumptions, and not a density number asked to tell a story it cannot tell alone.