
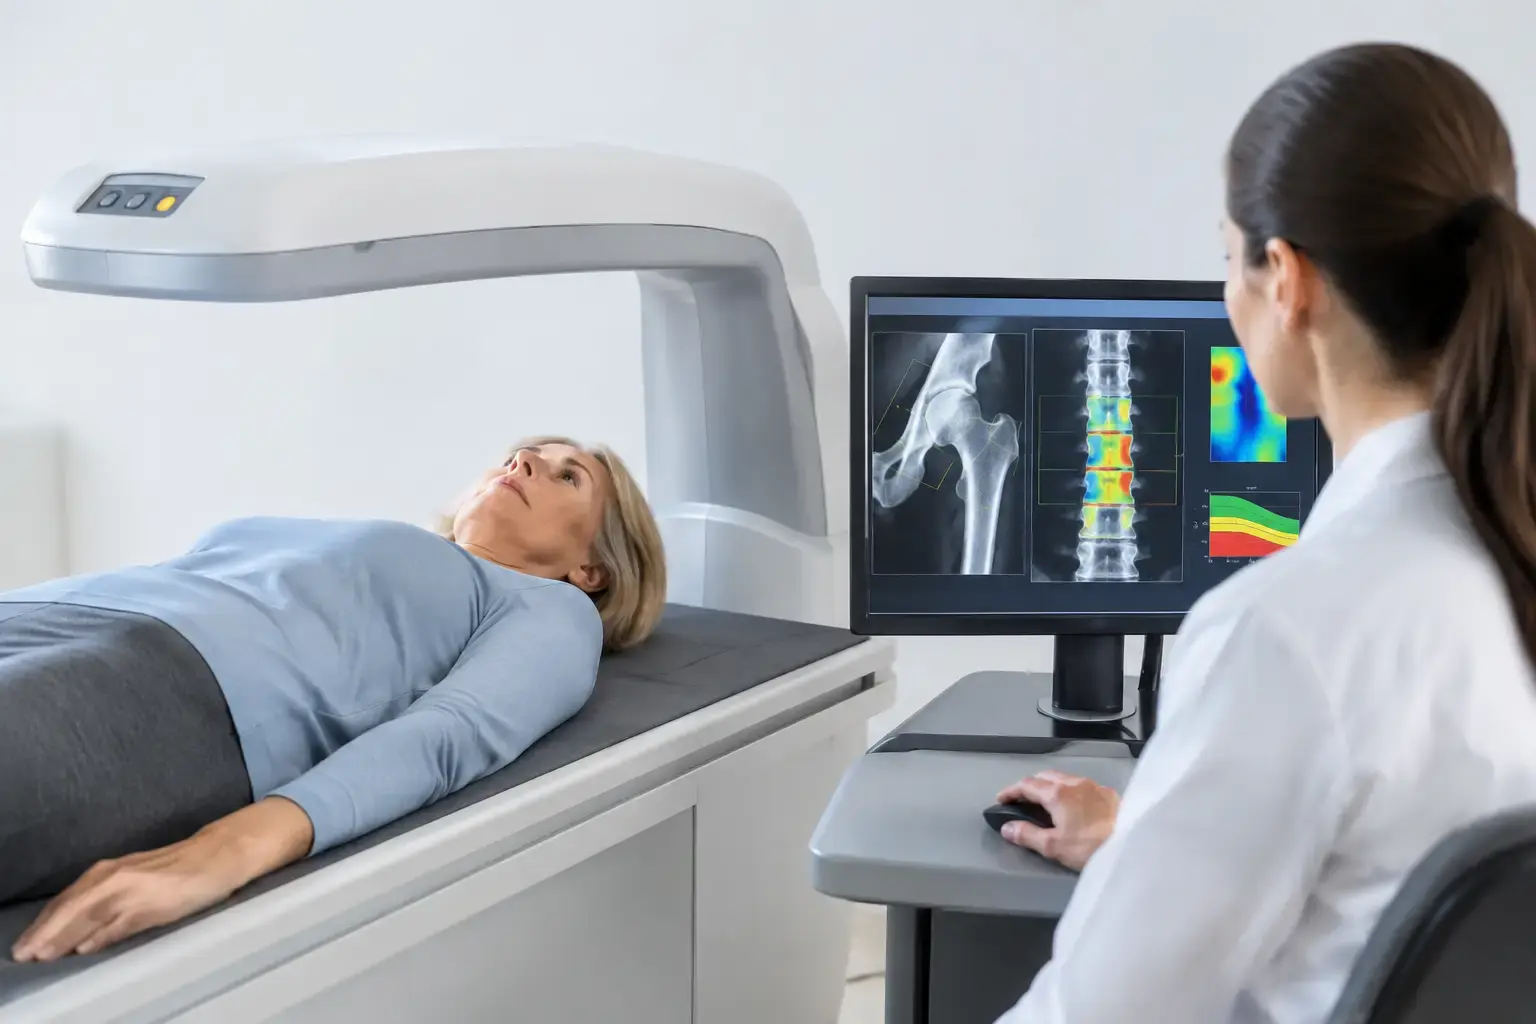
A bone density result can look reassuring and still leave an important question unanswered: how likely is your bone to fracture? Fracture prediction is not just a matter of measuring how much mineralized bone you have. It also depends on whether that bone is showing signals associated with greater fragility.
This distinction matters if you have osteopenia or osteoporosis, are moving through menopause, take medications that affect bone, or simply want bone data before a problem forces the issue. It is especially relevant in type 2 diabetes, where bone mineral density can be normal or even higher than expected while fracture risk remains elevated.
Bone health has long been discussed through a single number. That number is useful. It is not the whole story.
Why bone density alone cannot complete fracture prediction
Bone mineral density, often reported as a T-score, estimates the amount of mineralized bone in a measured area. Low density is a well-established fracture risk factor. It helps identify osteoporosis, follow population-level treatment guidelines, and establish whether bone mass is changing over time.
But density does not directly describe every feature associated with skeletal fragility. Two people can have the same T-score at the hip or spine and carry different fracture risk. One may have a prior fragility fracture, a history of glucocorticoid use, or a health condition that affects bone quality. Another may have ultrasound signal characteristics associated with greater fragility despite a similar density measurement.
This is not a flaw in density measurement. It is a limitation of asking one measurement to answer several different biological questions.
Think of it this way: density answers, “How much mineralized bone is present?” That is essential information. Fracture prediction asks a broader question: “Given the density and other signs of fragility, what is the likelihood of a fracture over a defined period?” Those are related questions, but they are not identical.
Clinical fracture-risk models already recognize this difference. They incorporate factors such as age, sex, body size, previous fracture, parental hip fracture, smoking, alcohol use, rheumatoid arthritis, glucocorticoid exposure, and selected secondary causes of osteoporosis. Each factor can change risk even when density stays the same.
The challenge is that some people want more direct information about the bone itself, not only a list of risk factors around it.
The type 2 diabetes example
Type 2 diabetes makes the density-versus-risk gap especially visible. Studies have consistently found that people with type 2 diabetes can experience higher fracture risk even when their bone mineral density does not appear low. The reasons are likely multifactorial: chronic hyperglycemia may affect bone tissue properties, diabetes can increase fall risk through neuropathy or vision changes, and some diabetes medications and complications may contribute.
The practical point is not that a normal density result is meaningless. It is that “normal” does not always mean “low risk.” When a condition changes the relationship between density and fracture, additional information becomes more valuable.
What a meaningful fracture-risk estimate includes
A fracture-risk estimate is a probability, not a prediction of fate. It cannot tell you whether a specific fall will happen or whether a fracture will occur on a particular date. What it can do is organize available information into a clearer view of risk over time.
For a useful conversation with your clinician, the estimate needs context. Age matters because fracture rates rise as bone loss, falls, medications, and other health conditions become more common. Prior fragility fracture matters because a fracture after a low-trauma event is evidence that the skeleton has already been tested under ordinary conditions.
The location of low density also matters. Hip and spine measurements do not always move together. A lumbar spine result can be influenced by degenerative changes that become more common with age, while hip density may tell a different story. This is one reason a single score should not be treated as a complete skeletal profile.
Then there is the question density cannot fully answer: does the measured bone show ultrasound-derived signals associated with fragility?
How REMS adds information to fracture prediction
Radiofrequency Echographic Multi Spectrometry, or REMS, uses radiation-free ultrasound to assess bone mineral density at the lumbar spine and proximal femur. It measures density, but it also analyzes the raw ultrasound signals reflected from bone.
From those signals, REMS derives an independent Fragility Score. The score reflects ultrasound signal characteristics associated with skeletal fragility that bone density alone does not capture. It does not replace density, and it should not be confused with a direct measurement of bone strength, flexibility, microarchitecture, or failure load. Those are distinct concepts and require distinct methods of assessment.
What REMS does is bring density and a separate fragility-related signal into the same assessment. The technology then weighs those two measures to estimate five-year fracture risk.
That creates a more complete set of questions for you and your clinician to consider:
- How much mineralized bone is present?
- Is the bone showing a greater degree of ultrasound-derived fragility signal?
- Taken together, what does that suggest about fracture risk over the next five years?
For someone with osteopenia, this can clarify why a T-score alone may feel incomplete. For someone with a density result in the normal range but risk factors such as type 2 diabetes or long-term glucocorticoid exposure, it can add relevant information without assuming that density tells the whole story.
Why precision changes the value of follow-up
Bone measurements are most useful when they can be compared over time. But every testing method has some degree of measurement variation. If a change is smaller than the method’s expected error, it may be difficult to know whether your bones changed or the measurement simply varied.
REMS is FDA-cleared and radiation-free, with an intra-operator precision error below 0.5%. For context, published precision errors for DXA at the spine are commonly in the range of 0.9% to 1.9%. Precision is not a technical footnote. It affects how confidently changes can be interpreted when monitoring bone over shorter intervals.
A tighter measurement can be particularly meaningful during periods when bone status may change faster than usual. Menopause is one example, as estrogen decline can accelerate bone loss. Rapid weight loss, some cancer treatments, long-term steroid exposure, and certain endocrine conditions may also make the timing of bone assessment more relevant.
That does not mean every person needs repeated scanning on the same schedule. The right interval depends on the reason for monitoring, the clinical context, and the decisions being considered. It does mean that when repeat measurement is useful, precision affects whether the trend deserves attention.
What to do with more complete bone information
More information should make decisions clearer, not more alarming. A fracture-risk estimate is most useful when it becomes part of a clinical conversation alongside your health history, medications, prior imaging, laboratory findings when relevant, and plans for the future.
If you are considering osteoporosis medication, a baseline assessment can help frame the conversation. If you are managing osteopenia, the added Fragility Score may help distinguish a density result from the broader question of fragility. If you are preparing for orthopedic surgery, objective bone information may be useful to bring to your surgical team.
For prevention-minded adults, the value may be simpler: you track blood pressure, lipids, glucose, fitness, and body composition because silent changes are easier to address when they are visible. Bone deserves the same attention. Peak bone mass is largely built early in life, genetics influences much of the ceiling, and bone loss can begin well before a fracture makes the issue impossible to ignore.
MobileREMS provides three numbers designed to be understood together: bone mineral density, an independent Fragility Score, and estimated five-year fracture risk. None should be interpreted in isolation. Together, they offer a more useful starting point than density alone.
Your bones do not need to become a source of fear. They deserve to become knowable - before consequences have to explain them for you.