
A fracture is often treated as the first clear signal that bone health needs attention. Biologically, it is usually a late signal. If you are asking how to track bone changes, the more useful question is not simply whether your density has changed. It is whether you can see meaningful changes in your bone status before a consequence forces the conversation.
Your bones are living tissue. They are continually remodeled, responding to age, hormones, illness, medications, nutrition, mechanical loading, and changes in body weight. But that remodeling is mostly invisible. A scan is a way to make part of that process measurable - provided you understand what the measurement can, and cannot, tell you.
Bone changes are not one thing
Bone mineral density, or BMD, measures how much mineralized bone is present in a given area. It is an established and valuable part of assessing skeletal health. A lower density is associated with greater fracture risk, which is why T-scores and Z-scores have become familiar to many people.
Yet density is not the same as bone strength, and it is not a complete description of fragility. Two people may have similar density results at the hip or spine while carrying different levels of fracture risk. Their medical histories may differ. One may have type 2 diabetes, long-term glucocorticoid exposure, a history of cancer treatment, or rapid weight loss. The structural signals associated with fragility may differ as well.
This distinction matters most when a result feels reassuring but the larger picture does not. Type 2 diabetes is a clear example: bone density can be normal, or even higher, while fracture risk remains elevated. Diabetes-related changes in bone material and the effects of complications such as falls help explain why density alone may not tell the whole story.
Tracking bone changes, then, means following more than a single number whenever better information is available. It means understanding the amount of mineralized bone, signs associated with fragility, and what those measures suggest about fracture risk together.
Why a single scan cannot show a trend
A baseline scan is a starting point, not a movie of your bones. To identify a trend, measurements must be repeated and compared in a way that separates real biological change from normal measurement variation.
Every testing method has some degree of precision error. Positioning, the specific skeletal site measured, the device, and the method used to analyze the result can all influence a number. If a small difference between two scans falls within the expected variability of the test, it may not represent a meaningful change in bone.
That is why timing matters. Bone remodeling is continuous, but density changes generally emerge over time rather than from one week to the next. The appropriate interval for repeat assessment depends on your baseline findings, age, menopause status, medical history, medications, and the decision being followed. Someone establishing an early baseline is in a different situation from someone monitoring known osteoporosis or a period of rapid physiologic change.
The goal is not to test as often as possible. It is to measure at intervals where the result can answer a real question.
How to track bone changes with usable data
A useful tracking approach begins with comparability. When possible, compare the same anatomical sites using the same measurement method and a report that clearly identifies what changed. The lumbar spine and proximal femur are particularly important sites because they are commonly assessed for bone density and are clinically relevant to fracture risk.
A report is more useful when it lets you follow several related measures over time:
- Bone mineral density, expressed in absolute terms and often alongside T-scores or Z-scores
- The skeletal site measured, since spine and hip results may not move in the same direction
- An independent measure of fragility, when available
- An estimate of fracture risk that puts the measurements into a clinically meaningful frame
Context belongs beside the numbers. A report cannot know, on its own, whether you entered menopause, began or stopped a medication, experienced major weight loss, developed a chronic condition, or had a prior fracture. Those details affect how a clinician interprets a result and whether an apparent change deserves attention.
It can also help to keep prior reports rather than relying only on a verbal summary such as “normal” or “osteopenia.” Those labels are useful categories, but they can hide the actual values, the site-specific results, and the direction of change. A person can remain in the same diagnostic category while still showing a meaningful trend.
What REMS adds beyond density
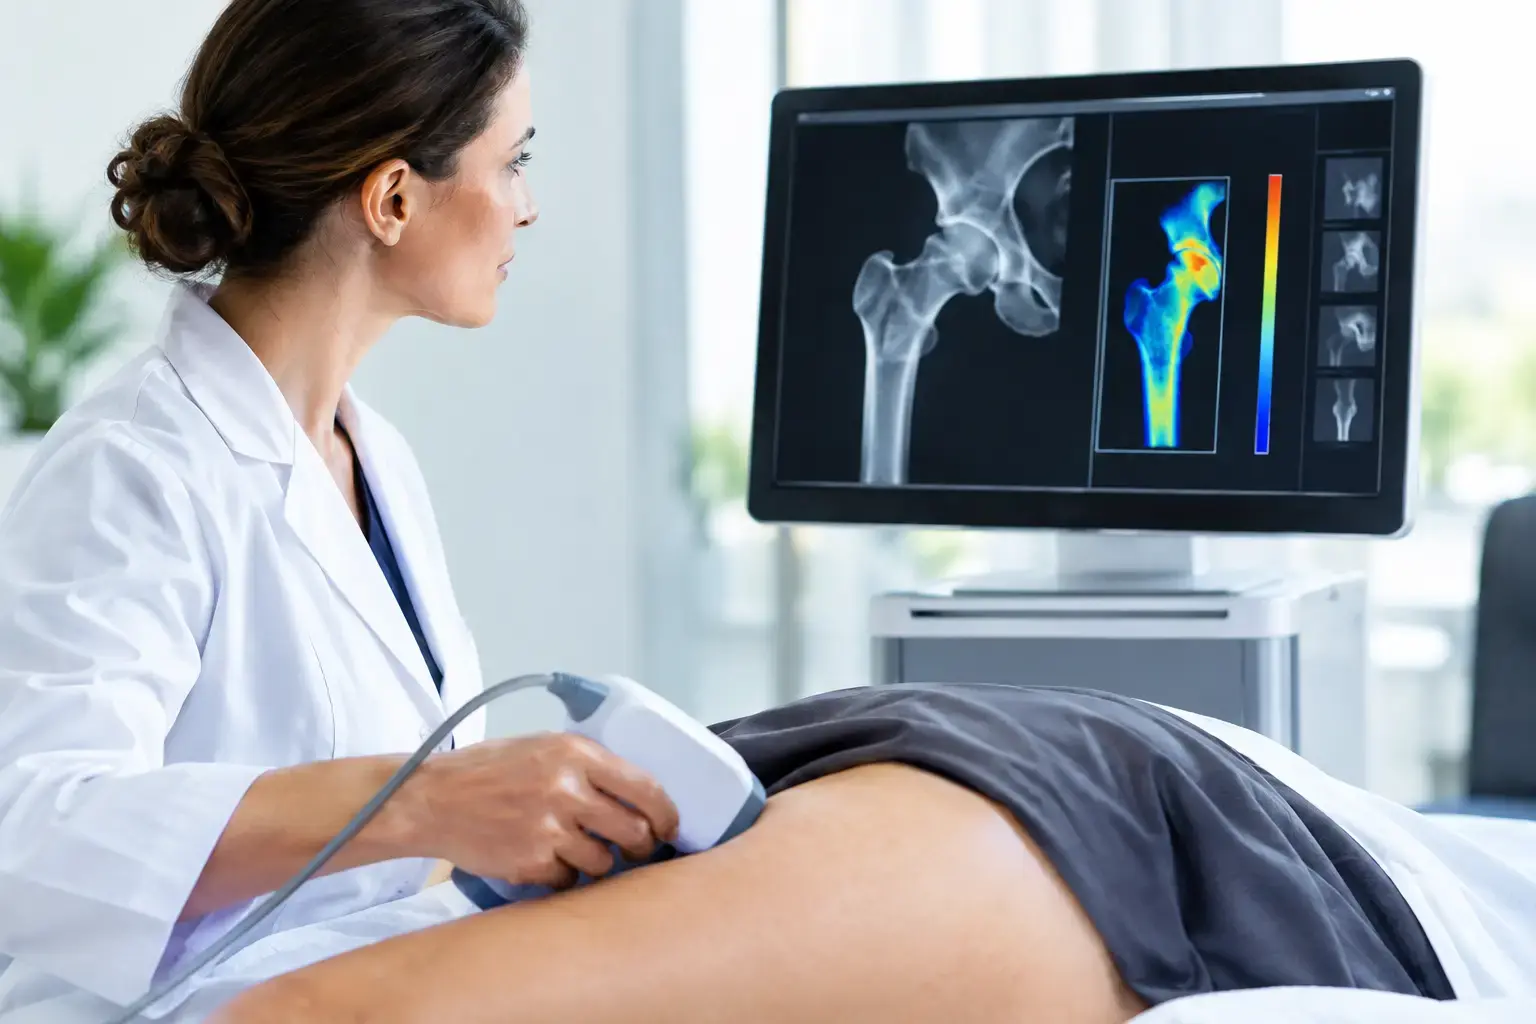
REMS, or Radiofrequency Echographic Multi Spectrometry, uses radiation-free ultrasound to measure bone mineral density at the lumbar spine and proximal femur. It also analyzes raw ultrasound signals reflected from the bone to derive an independent Fragility Score.
The Fragility Score does not replace density. It answers a different part of the bone-health question: whether the reflected signal shows signs associated with greater skeletal fragility that density alone does not capture. REMS then weighs density and Fragility Score together to estimate five-year fracture risk.
That creates a more complete conversation around a scan. How much mineralized bone is present? Is there information in the ultrasound signal suggesting greater fragility? What do those findings mean together for estimated fracture risk over the next five years?
For tracking, precision is central. If an instrument has too much expected variation, small changes cannot be distinguished confidently from measurement noise. REMS has reported intra-operator precision error below 0.5%, compared with the 0.9% to 1.9% typically reported for DXA at the spine. Lower measurement error does not make every small difference clinically significant, but it can make earlier re-measurement more informative when there is a genuine reason to monitor.
This is particularly relevant during periods when bone may change more quickly, including the menopause transition, certain medical treatments, and substantial changes in body weight. It is also relevant for people who have already been told they have osteopenia or osteoporosis and want to understand whether density tells the entire story of their skeletal risk.
Numbers need interpretation, not panic
A change in one result is not automatically good or bad news. A density value may differ across sites because the spine and hip do not necessarily respond identically. Degenerative changes in the spine can also complicate density interpretation, especially later in life. A Fragility Score and fracture-risk estimate add information, but they remain part of an overall clinical assessment rather than a diagnosis by themselves.
Similarly, a stable density result does not mean that every risk factor has disappeared. Fall risk, prior fractures, family history, smoking, alcohol exposure, medications, endocrine conditions, and chronic disease can all shape fracture risk. The value of tracking is not that it produces a perfect forecast. It is that it replaces assumptions with a clearer, repeatable record.
Biochemical markers of bone turnover may sometimes be used in clinical care as well. They reflect aspects of bone formation and resorption, not the amount of bone at the hip or spine and not an independent assessment of ultrasound-based fragility. They answer a different question and may be affected by timing and other biological variables.
The value of knowing before consequences
Most people can tell you their cholesterol trend, their blood pressure, or their average glucose. Far fewer know their bone density baseline, whether there are signs of greater fragility beyond density, or how their estimated fracture risk is changing. That gap is especially striking because peak bone mass is largely built early in life, while gradual loss can begin long before a fracture makes the issue visible.
A clear baseline does not create a problem. It gives you a reference point for future decisions and a report that can be discussed with your physician or care team. If you already have prior scans, bringing those reports into the conversation can turn isolated numbers into a meaningful timeline.
Your bones do not need to become an emergency before they become measurable. The practical advantage of tracking is simple: you can see more of the story while there is still time to understand it.